G! Marketing/Case Studies/M.O. Graphics
11 leads a month
became 82.
On $40 a day.
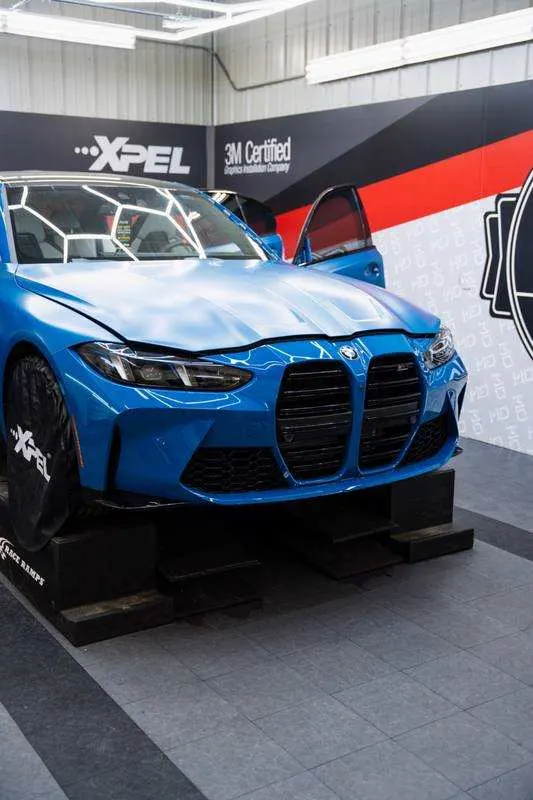
M.O. Graphics wraps vehicles and installs XPEL paint protection in New Lenox, Illinois, competing in Google auctions against national franchises and the manufacturer's own website. G! Marketing runs their engine on a pay-per-lead model: a mobile-first landing page built to convert, a Google Ads account tuned monthly, and a deal where we only win when the phone rings. Seven months of exports, laid out below.
● Google Ads overview exports + landing page form log · Jan 1 to Jul 31, 2026 · every figure reconciles
Landing page form fills by month
Every submission is timestamped in the form log. Line them up by date and the story tells itself.
378 form fills January through July 2026 (380 in the export through August 1), from the landing page form log. January and February ran on the old setup: 34 fills combined. From March on, the rebuilt page and campaigns averaged 69 a month and never dropped below 61. Form fills count all traffic sources, including organic; ad-tracked conversions are broken out separately in the appendix.
01 / The record
 01 / The record
02 / The problem
 02 / The problem
A local wrap shop bids against the manufacturer. And the franchise. And a dozen other shops.
Search "car wrap near me" in Chicagoland and the auction underneath is brutal: xpel.com (the manufacturer of the film itself), speedpro.com (a national franchise), and a dozen hungry local shops, all bidding for the same phone. The buyer is on their phone, dreaming in matte black, and they will fill out exactly one form. Winning that auction on $40 a day takes two things most shops never get: a page built to convert the click, and an account tuned every single month. M.O. Graphics pays us per lead, so if either one slips, it comes out of our side of the table.
They pay for results, not promises. This page is what that looks like in the exports.
03 / The rebuild
 03 / The rebuild
February was the worst month. So we rebuilt it.
Feb → Mar 2026We publish the bad month too. In February the account chased reach: 25,554 impressions, the most of any month all year, and it produced just 22 tracked leads at $53.11 apiece. Impressions are not leads. So in March we did the opposite of what a vanity report would suggest: we cut reach by two-thirds and rebuilt what the click landed on, launching the new mobile-first landing page and a tightened campaign structure together.
February vs March 2026, same account, same client, nearly identical spend ($1,168.42 vs $1,267.84).
And it held. Every month since the rebuild has landed between 61 and 82 form fills, with cost per tracked lead grinding down to $15.22 by June. That's the difference between a campaign that got lucky and an engine that got built.
04 / The landing page
 04 / The landing page
Built for a buyer holding a phone in one hand.
The data made the design brief for us: 87% of ad clicks and 86% of conversions happen on mobile. So the page is not a brochure. It is a funnel that does one thing: turn a daydream about a wrap into a submitted form, before the buyer's attention moves on.
Why it converts
One page, one job.
No navigation to wander off into. Real wrap work, not stock renders. Proof up top, price anchoring where it helps, and a form the moment intent peaks.
The form is a configurator, not a contact form. Pick the service, and it asks exactly the right follow-ups: vehicle year and model for a color change, fleet details for commercial, coverage area for PPF. The lead that arrives is already qualified, which is the whole point of paying per lead.
What the buyer types
The searches we win.
Seven months of search terms reads like a wish list: "car wrap near me," "car wrap chicago," "company vehicle wraps," "full car wrap," "ppf." High-intent, local, ready to spec a vehicle. The keyword table with clicks and cost is in the appendix.
And the audience is exactly who you'd guess: 78% male, heaviest from 25 to 54, browsing hardest on Sundays, when the dream car gets researched from the couch.
05 / The auction
 05 / The auction
The biggest name in the auction is the local shop.
Google's auction insights name every advertiser you actually compete against, and their share of the auction. In July 2026, M.O. Graphics held the largest impression share of every advertiser on the list, ahead of the national SpeedPro franchise and ahead of xpel.com, the manufacturer whose film M.O. installs.
Impression share, Google Ads auction insights, July 1–31, 2026. Advertisers Google reports below 10% are shown at the reported "<10%" ceiling. M.O.'s ads also hit the top of the page 71–84% of the time in every month of 2026.
Read that again: on $40 a day, a single-location shop in New Lenox shows up in these auctions more than advertisers with national budgets. That is not spend. That is relevance: tight keywords, a page Google's own quality systems reward, and seven months of weekly tuning.
06 / What 380 leads look like
 06 / What 380 leads look like
Every lead tells us what it wants. And where it came from.
Because the form is a configurator, the lead log doubles as market research. Here is the service mix across all 380 submissions, and what the leads themselves answered when asked "how did you hear about us?"
Service mix
"How did you hear about us?"
Self-reported by the leads themselves in the form, all 380 submissions. Four out of five point at Google, which is exactly where the engine spends. (Our favorite row: 17 people walked in because a wrapped vehicle drove past them. The product advertises itself; the ads make sure Google does too.)

07 / Why this scales
"Pay-per-lead only works when you trust your own engine. We put our fee on the same side of the table as the client's results, then publish the exports. Seven months in, the local shop holds the biggest share of an auction that includes the manufacturer itself. That's what a page built to convert plus an account tuned monthly buys you, on forty dollars a day."
08 / The verified data
 08 / The verified data
The proof is the exports.
Every number on this page reconciles against the monthly Google Ads overview exports (January through July 2026) and the landing page form log exported August 2, 2026. If you own the account, audit us.
| Month (2026) | Spend | Impressions | Clicks | Tracked leads | Cost / lead | Form fills |
|---|---|---|---|---|---|---|
| January | $810.40 | 6,486 | 226 | 29 | $27.94 | 11 |
| February | $1,168.42 | 25,554 | 416 | 22 | $53.11 | 23 |
| March | $1,267.84 | 8,845 | 474 | 52 | $24.38 | 61 |
| April | $1,205.59 | 9,426 | 630 | 59 | $20.43 | 67 |
| May | $1,215.13 | 10,456 | 660 | 57 | $21.32 | 66 |
| June | $1,217.40 | 12,541 | 714 | 80 | $15.22 | 82 |
| July | $1,224.49 | 15,651 | 786 | 64 | $19.13 | 68 |
| 7 months | $8,109.27 | 88,959 | 3,906 | 363 | $22.34 | 378 |
"Tracked leads" are Google Ads conversions (ad-attributed calls and forms). "Form fills" are landing page submissions from all traffic sources, timestamped in the form log; the export runs through August 1 (380 total, 378 inside the January–July window). The two columns measure different things and are never summed.
| Top keywords (7 months) | Clicks | Cost |
|---|---|---|
| car wraps | 636 | $1,258.31 |
| company vehicle wraps | 264 | $722.92 |
| full car wrap | 190 | $339.22 |
| car wrap Chicago | 104 | $206.07 |
| vehicle wrap shop | 68 | $98.83 |
| vinyl wrap shop | 67 | $104.34 |
| car paint protection | 66 | $208.91 |
| ppf | 29 | $65.06 |
How to read these numbers
- Two measurement systems, kept separate. Google Ads conversions (363) are ad-attributed calls and form actions. Landing page form fills (380) count every submission from every source, including organic search and word of mouth. We never add them together, and every stat on this page says which one it uses.
- Cost per lead is computed, not quoted: monthly spend divided by that month's tracked conversions, straight from the campaign exports. The blended $22.34 is total spend over total conversions for all seven months, bad February included.
- January clicks (226) come from the device report in that month's export, because the January overview didn't include a network breakdown. Every other month's clicks come from the network report.
- The auction leaderboard is Google's own auction insights for July 2026: the advertisers Google names as competing in the same auctions, with their impression share as reported. Rows Google reports as "<10%" are drawn at that ceiling, not at an invented value. Impression share measures presence in eligible auctions, not sales.
- The March inflection is the observed, timestamped record: the rebuilt landing page and tightened campaign structure launched together, so we don't claim to separate their individual contributions. What we claim is the series: 11, 23, then 61–82 every month since.
- "$40 a day" is $8,109.27 across 212 days, which is $38.25. We round in the less flattering direction.
- Individual submissions stay private. The form log contains names and contact details of real leads. It exists, it's timestamped, and it's only ever published in aggregate.
- No revenue claims. Wrap jobs quote and close in the shop. We publish marketing-system metrics we can source, and nothing else.
09 / Next
Want an engine where we only win when you do?
No pitch deck. The exports above are the pitch. Tell us who you are and we'll put together a punch list on your current ads, landing pages, and search visibility, the same way we started with M.O.
info@gmarketing.digital