 02 / The problem
 03 / The Alpha Growth Engine
LAYER 01
One pipeline
Google Ads calls, form fills, and Meta lead forms all flow into a single system with source attribution. Nothing lives in a personal inbox. Nothing falls through.
G! Marketing/Case Studies/Alpha Development Group
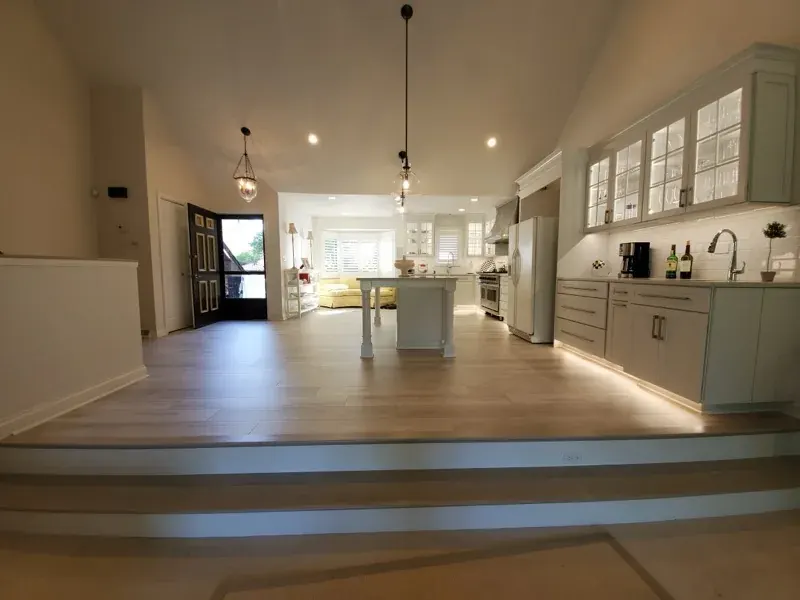
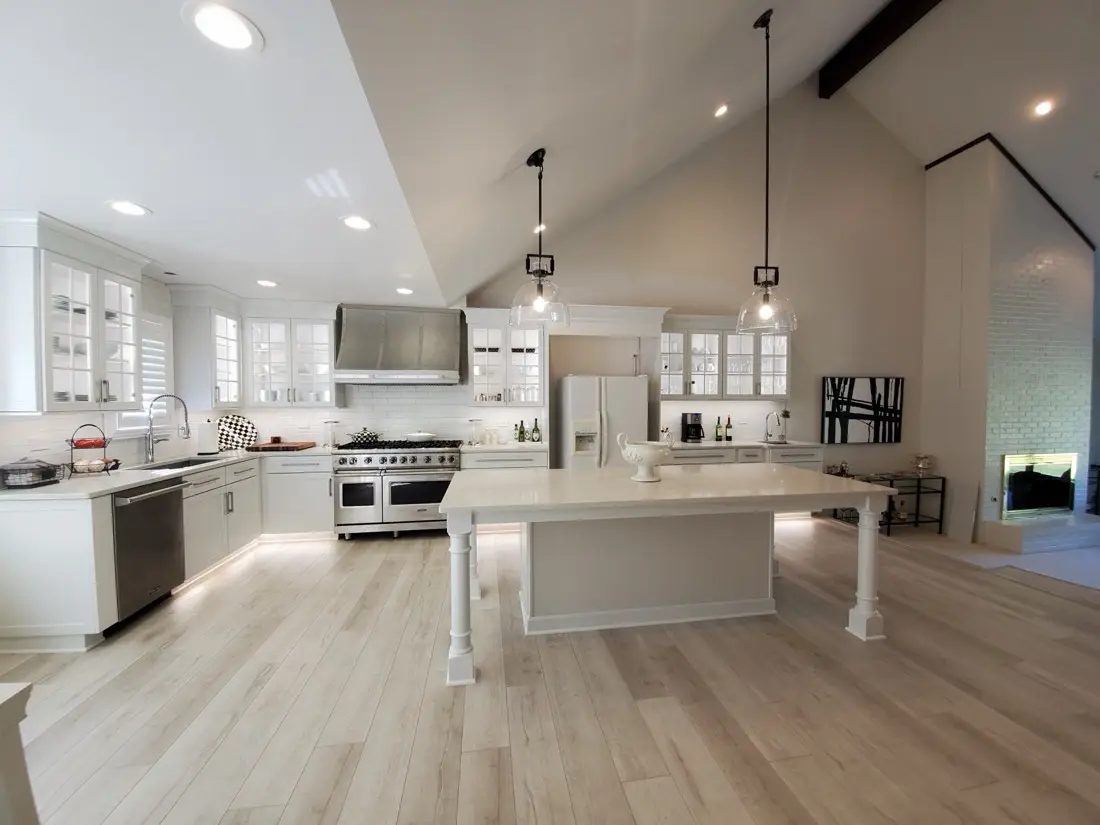
Alpha Development Group remodels kitchens, bathrooms, and basements across Orland Park and the Chicago suburbs. In one quarter, G! Marketing rebuilt their website, coded them a custom lead management system that answers every lead by text in about 90 seconds, and rebuilt their ads from a $7.19 cost per click down to $0.53. This page is the month-by-month record, taken straight from the reports we sent the client.
● April to June 2026 monthly client reports · Google Ads, Meta, and Search Console exports on file
Tracked leads by month
Google Ads conversions (calls + forms) plus Meta lead forms, April to June 2026.
CPC figures are Google Ads average cost per click for the month. * Meta launched in the final days of May; the 4 leads shown are from its first four days only. April tracked phone calls only; full call-plus-form conversion tracking came online in May. Full monthly table in the appendix below.
01 / The record
02 / The problem
A kitchen remodel is a $50,000-plus decision, and homeowners shop it hard. Research keeps landing on the same conclusion: the odds of reaching and qualifying a lead collapse within minutes of the inquiry, not hours. Most remodelers run their marketing like a billboard: a website that sits there, ads that burn budget on the wrong clicks, and leads that wait in an inbox until somebody climbs off a job site. Alpha Development Group hired us to build the other thing: an engine.
Speed to lead: before vs. the Alpha Growth Engine
Before: the inbox
0:00:00
A homeowner fills out the form. It lands in an email inbox. Somebody sees it whenever they're next off the job site.
Waiting…
With the Growth Engine
0:00:00
The same form fill hits the lead management system, which texts the homeowner back and alerts the team by SMS and email. Automatically. Every time.
Waiting…
Before automation, first response averaged 1 to 2 hours. With the Growth Engine's SMS flywheel live, it is 1 to 2 minutes, on every lead, including the ones that come in during a demo day. Speed is not a courtesy. It is the highest-leverage conversion variable in home services.
03 / The Alpha Growth Engine
The Alpha Growth Engine is a custom lead management system built specifically for how ADG runs jobs. Every call, form, and ad lead lands in one pipeline the whole team actually uses, and the automation layer does the work no busy crew can: instant follow-up, in both directions, around the clock.
LAYER 01
Google Ads calls, form fills, and Meta lead forms all flow into a single system with source attribution. Nothing lives in a personal inbox. Nothing falls through.
LAYER 02
The moment a lead arrives, the customer gets a text and the team gets an SMS and email alert. First response went from 1–2 hours to 1–2 minutes. Live on both the customer side and the internal side since June.
LAYER 03
The system recognizes returning customers automatically and pulls their new projects into one recurring profile. The kitchen client from last year who calls about a basement is greeted like the repeat customer they are.
Repeat customers re-enter the loop already known, already trusted, already in the system.
The ads make the phone ring. The Growth Engine makes sure ringing turns into booked estimates.
04 / Month one: the foundation
Month one was a build month, and we don't hide what build months look like. In thirty days we shipped the entire foundation, then turned the ads on and published the baseline, because you can't prove growth without a starting line you're willing to show.
The baseline the first campaigns produced: 277 clicks at a $7.19 cost per click, 9 tracked calls, $1,997.78 spent. Honest numbers for a brand-new account in one of the most competitive local categories there is. Month two is where we went to work on them.
05 / Month two: the rebuild
The April campaigns were getting clicks from researchers, not buyers, at $7.19 apiece. Mid-May we made the call most agencies put off for a quarter: we paused the standard Search campaign and rebuilt everything as Performance Max. The before and after, same client, same month-over-month:
And May's total spend was $1,874.76, slightly less than April. More reach, more leads, less money.
The audience data confirmed we were finally reaching the buyer, not the browser: about 74% of impressions landed with homeowners 45 and up, skewing 61% female, which is exactly who makes the call on a kitchen.
May also shipped: Facebook and Instagram lead ads launched late in the month (4 form fills in the first 4 days), two new blog posts built around local "near me" searches, a deep rewrite of the bathroom services page, every page force-indexed into Google instead of waiting to be found, and the Google Business Profile climbing on new video posts and nine 5-star reviews.
06 / Month three: the compound
Month three is when a build stops being a set of projects and starts being an engine. The SMS flywheel went fully live on both sides. Meta got its first full month and earned a bigger share of budget. And the organic foundation laid in months one and two started ranking.
4,717 clicks at a $0.53 average CPC, 127,940 impressions, and 38 tracked conversions across calls and forms on $2,104.00 spent. Mid-month we shifted the campaign goal from phone calls to form fills and the form fills came immediately. That's the lever: with volume solved, the optimization target moves from "more leads" to "leads that close," tracked through the Growth Engine all the way to quote.
12 leads on 7,311 impressions and a roughly $1,000 budget the ads burned through so fast we halted them mid-month to stay on plan. The creative test had a clear winner: the founder's own before-and-after transformation video pulled 7 of the 12 leads, beating two polished presenter-style creatives. Real work, shown plainly, out-pulled produced ads, so Meta's budget share went up the next month.
Search impressions jumped 82% month over month (3,910 vs 2,150). Strip out people already searching the brand name and it's better: non-branded visibility grew 152%. The site now appears for 264 different searches, up from 173, with 160 brand-new queries entering the mix, and the money terms all moved:
| Search term | Movement in June |
|---|---|
| kitchen remodeling cost orland park il | Debuted at position 1.5 (page 1) |
| kitchen remodel orland park il | Up 18 positions |
| orland park aging in place remodeling | Up 20 positions |
| bathroom remodeling orland park il | Up 12 positions, impressions nearly doubled |
| kitchen renovation orland park | Up 10 positions, knocking on page 2 |
| remodel cost searches, Libertyville & Winnetka | Hit page 1 |
Clicks were roughly flat for the month (49 vs 63, the difference a normal dip in brand-name searches). That is exactly what this stage looks like: rankings climb from page 3–4 to page 2–3, impressions come first, clicks follow when terms cross into the top 10. The cost query already sitting at 1.5 is the proof of concept.
June also shipped: the returning-customer profiles inside the Growth Engine, a dedicated commercial remodeling page, and a truck-side QR landing page built for the person standing behind the truck at a stoplight instead of dumping them on the homepage.
07 / The blanket
June's combined footprint across ads, search, and social came to 170,572 impressions. Orland Park's population is about 58,000. That's the whole town, three times over, in thirty days, and the organic side of it is growing fastest.
Two months earlier this brand had essentially no social footprint. May's first full month posted a 7,000%+ jump from nothing; June grew another 233% on top of it. And because 80% of the viewers don't follow the page yet, this is not the same fans looping: it is a town discovering a contractor, for free, every week.
08 / Why this scales
"Ninety days is not a teaser window. It is enough time to rebuild the website, code the lead system, rebuild the ads twice, and publish the receipts. Everything on this page compounds from here: the rankings climb, the flywheel answers every lead, and the creative that wins gets the budget. This is what the first quarter of a G! engagement looks like, in public."
09 / The verified data
Every number on this page comes from the monthly reports we sent Alpha Development Group, backed by the Google Ads, Meta Ads Manager, Google Search Console, and Meta insights exports behind them. Clients get these numbers monthly whether they're good or not. April's are on this page too.
| Google Ads | Spend | Impressions | Clicks | Tracked leads | Cost / lead |
|---|---|---|---|---|---|
| April 2026 | $1,997.78 | 4,568 | 277 | 9 | $221.98 |
| May 2026 | $1,874.76 | 132,393 | 4,558 | 24 | $78.12 |
| June 2026 | $2,104.00 | 127,940 | 4,717 | 38 | $55.37 |
| 90 days | $5,976.54 | 264,901 | 9,552 | 71 | $84.18 |
Cost per lead is computed as spend divided by tracked conversions for the month. April tracked phone calls only; call-plus-form tracking came online in May, so April's true lead count may be modestly understated (which makes the improvement look smaller, not bigger).
| Meta lead ads | Window | Impressions | Leads |
|---|---|---|---|
| May 2026 | First 4 days after launch | partial | 4 |
| June 2026 | First full month (halted mid-month at ~$1,000 budget) | 7,311 | 12 |
June's creative split: 7 leads from the founder's transformation video, 5 from two presenter-style creatives. Budget share shifted toward Meta for the following month based on this result.
10 / Next
No pitch deck. The reports above are the pitch. Tell us who you are and we'll put together a punch list on your current website, ads, and search visibility, the same way we started with ADG.
info@gmarketing.digital Repeat customers re-enter the loop already known, already trusted, already in the system.
 05 / Month two: the rebuild
 06 / Month three: the compound
 07 / The blanket
 09 / The verified data